Financial Transparency
Curious about where your donations might go?
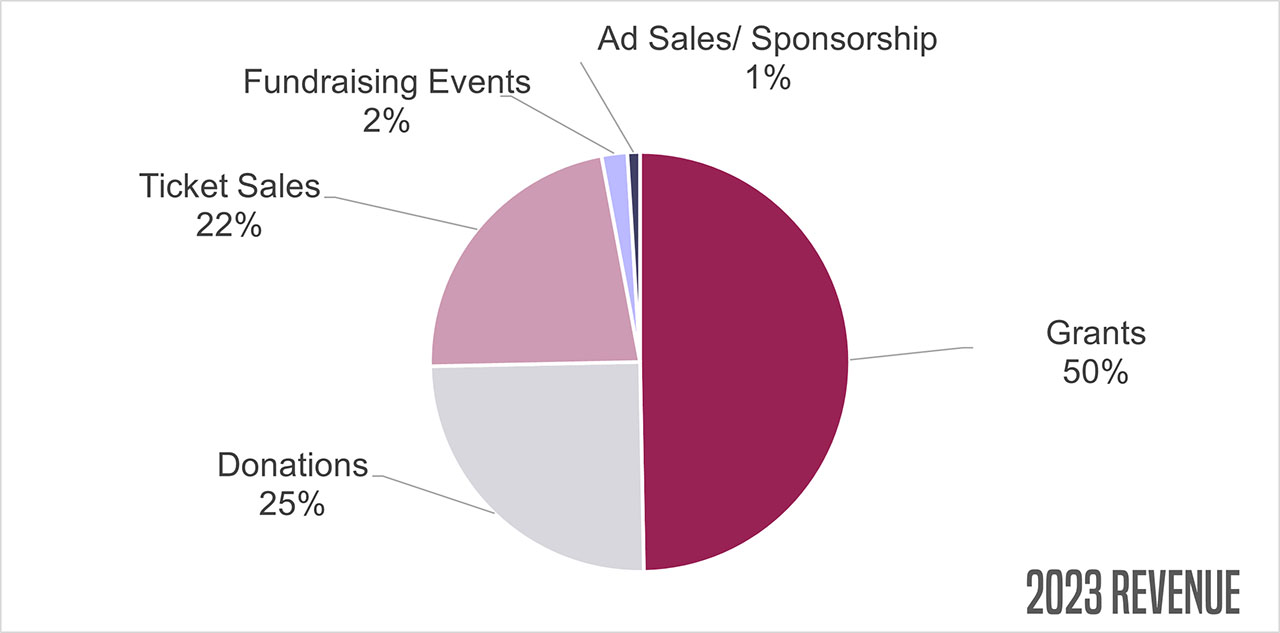
Below are insights into our annual income and expenses for 2023. Post-Pandemic, we chose to expand our Fighting Words Festival (a free festival of staged readings) to two weekends, and pair it with a full production to complete the season.
Annual Income (2023 Calendar Year)*

*Potential for 1%-2% margin of error based on rounding figures
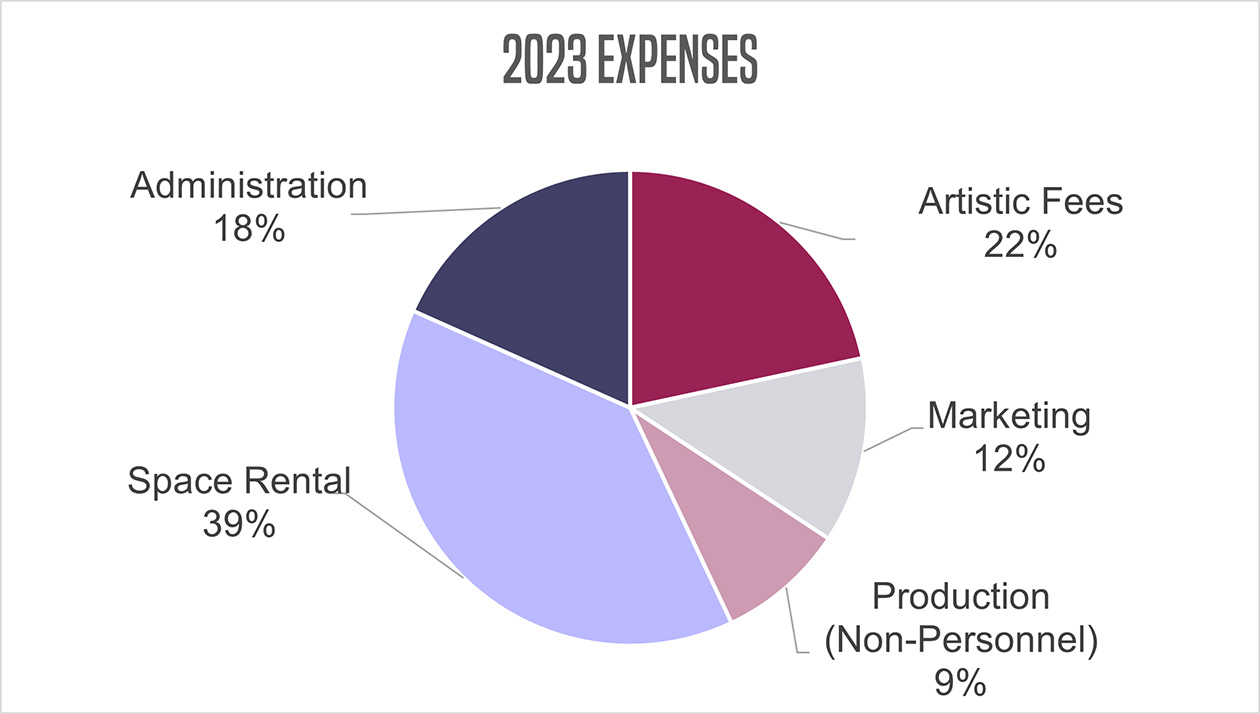
Annual Expenses (2023 Calendar Year)*

What does this chart say, other than where BWBTC’s money goes?
- 2/3 of the entire budget goes to artistic programming
- Outreach Programming includes our Fighting Words New Plays Development program and free public Festival, Fundamentals of State Combat for Artists of Color and other free offering on behalf of the company.
- Administration includes everything from basic office supplies to storage space to liability insurance, but not salaries as we are an entirely volunteer ensemble.
*Potential for 1%-2% margin of error based on rounding figure
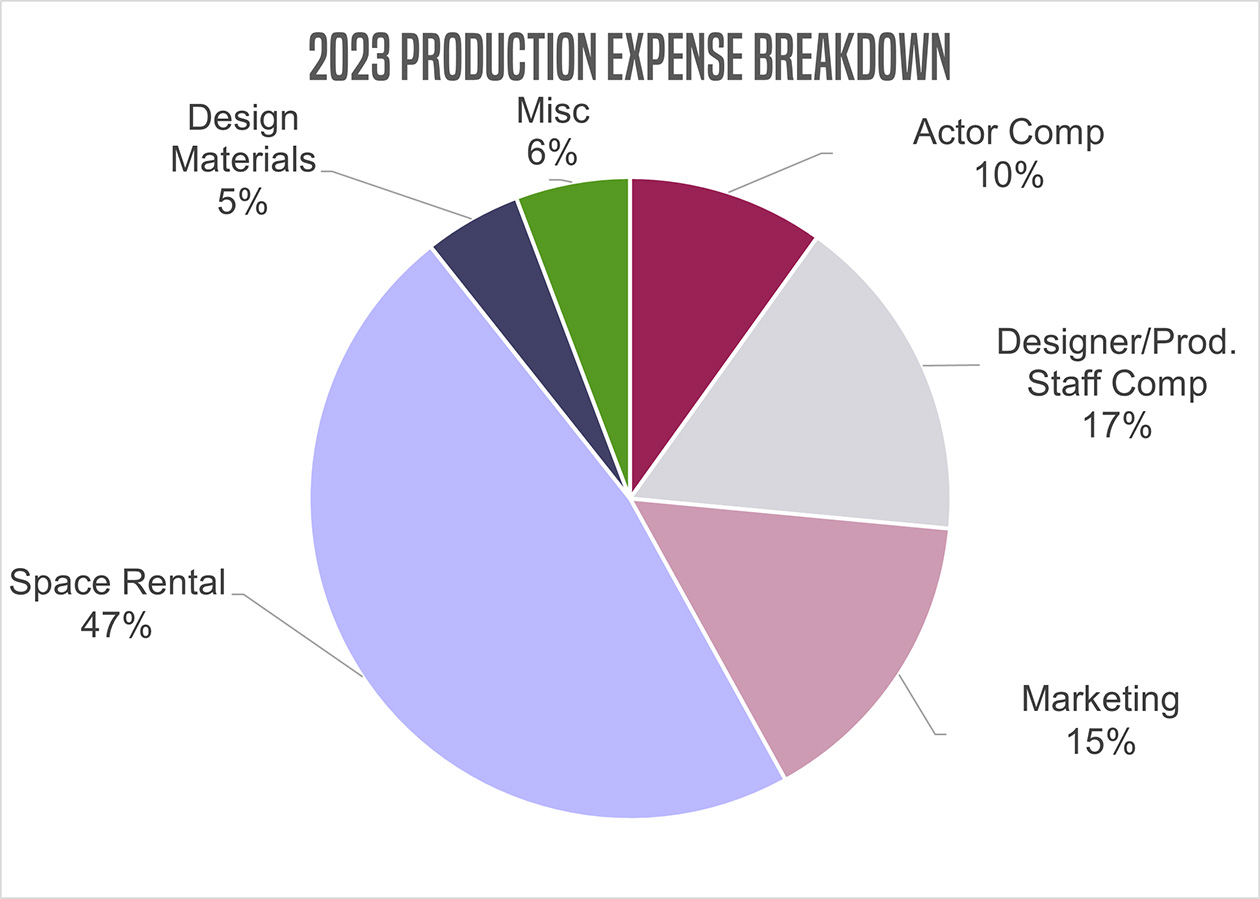
As you can see from above, 60% of our expenses go into the productions that fulfill our mission of telling stories from underrepresented groups using stage combat. But, how exactly does that break down? Check out the charts below to see the breakdowns for the two full productions we produced in 2019.
2023 Production Expenses*

*Potential for 1%-2% margin of error based on rounding figures
Percentages based off of amounts budgeted, not final expenses
Miscellaneous expenses include Accessibility items, COVID protection and other various items.
